The ResiRole-CASP15 Pipeline
Step 1: Retrive Data
The Critical Assessment of Techniques for Protein Structure Prediction has recently held their 15th community wide experiment, CASP15, in December of 2022. Groups from around the world are invited to submit models of selected target seqeuences, prior to the release of their experimental structures. In the most recent meeting (CASP15), there were 165 groups registered and over 53,000 models were submitted. Our laboratory group was granted access to our CASP15 dataset by the organizers on January 18th, 2023. We incorporated this data into the ResiRole pipeline in order to analyze the models produced by each structure prediction technique over selected difficulty categories. These difficult categories include Free Modeling (FM), Template Based Modeling-Easy (TBM-Easy), Template Based Modeling-Hard (TBM-Hard), FM/TBM, Other, and All.
Step 2: Predict Functional Sites With FEATURE
The central idea guiding ResiRole's assessment of structure prediction is that the more similar the functional site predictions of structure models are to the functional site predictions identified for the corresponding sites in the experimentally determined reference structures, the more accurate are the structure models. To compare models and reference structures on such bases, all models and reference structures are analyzed using the FEATURE program (version 3.0). The FEATURE algorithm is trained to score the residues in any structure passed to it based on the likelihood they participate in functional sites. To do that, FEATURE assesses the physiochemical properties around anchor residues within the structure and compares these properties to those associated with residues known to have functional sites of interest. See the FEATURE documentation for a full description of the program and its applications. ResiRole uses a list of 607 functional site models, referred to as SeqFEATURE models to score all potential functional sites in structure models and reference structures. FEATURE's results have undergone benchmarking such that it is possible to associate Z-scores of functional site predictions to estimates of corresponding sensitivity and specificity levels based on previously described known functional sites in experimentally determined structures.
Step 3: Calculate Performance Metrics for Each Structure Prediction Technique
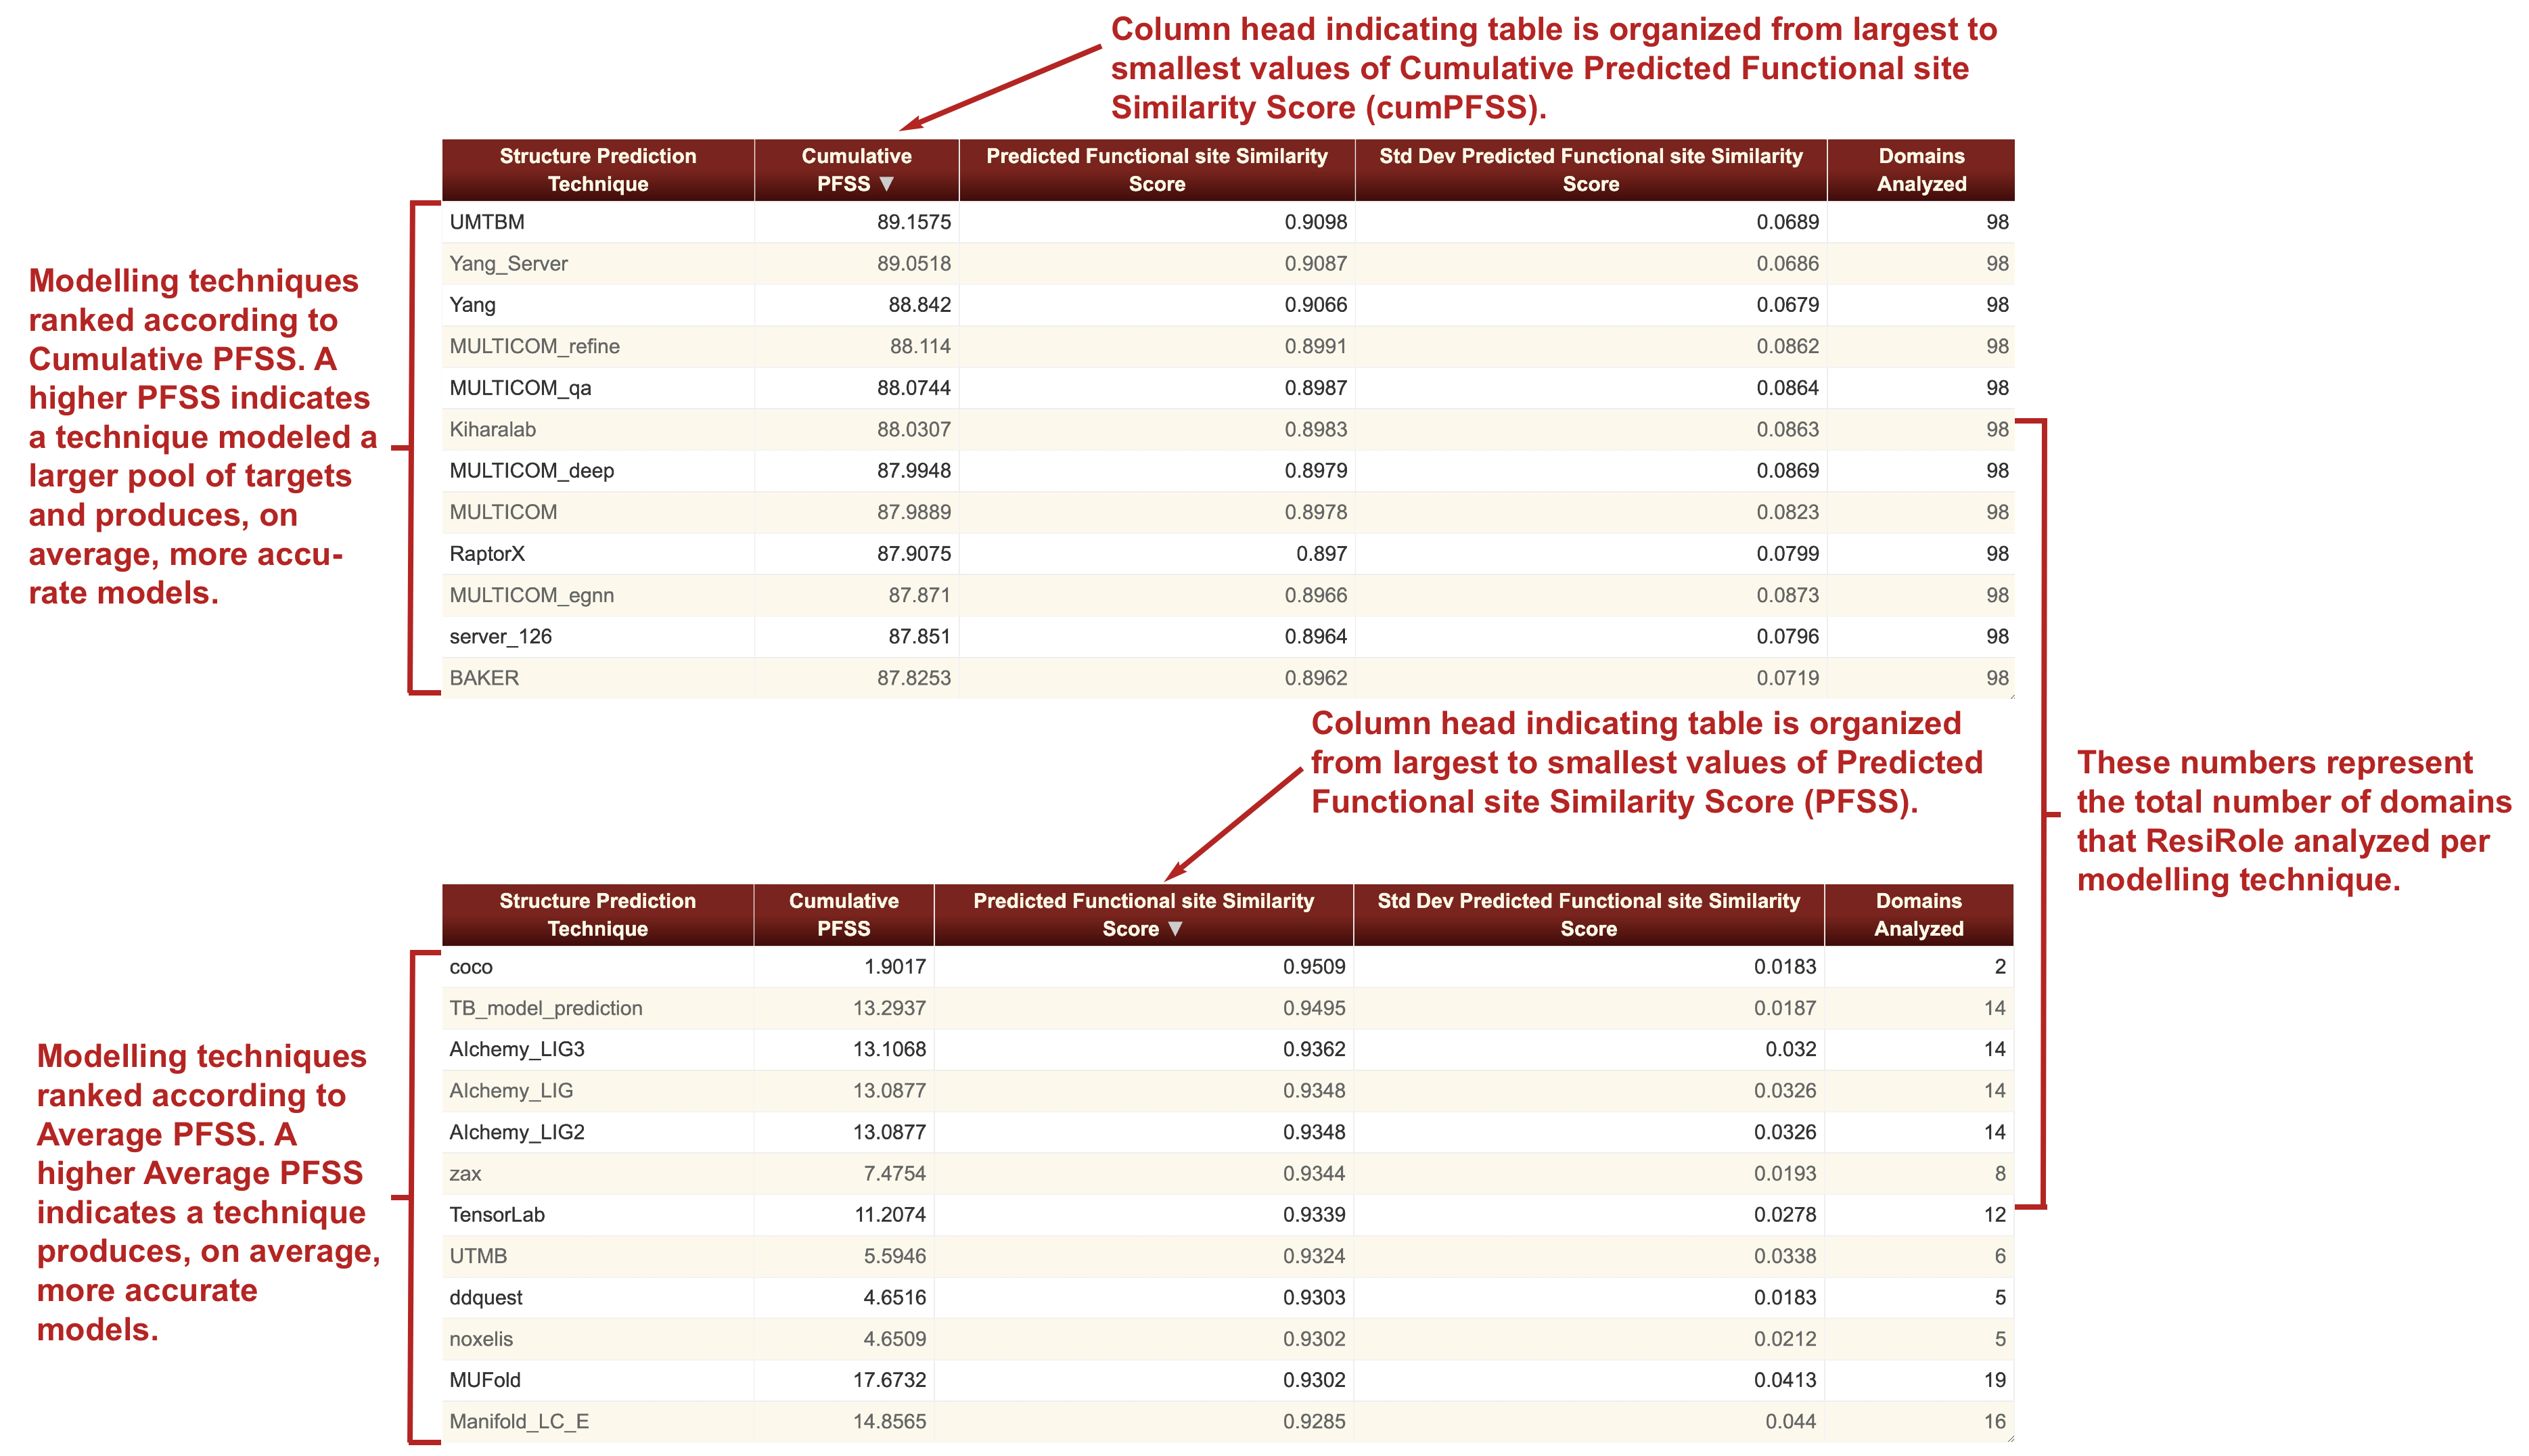
We define two metrics as the result of the analyses. Difference Score is calculated as the absolute value of the difference of the probabilities of the function site predictions in the structure models versus the functional site prediction probabilities at the corresponding sites in the experimental structure. A difference score is obtained for each instance of a functional site prediction that is made for each residue of each structure model. A similarity score was then calculated as one minus the difference score, that is 1 minus |Prob(target) minus Prob(model)|. The normalized Predicted Functional site Similarity Score (PFSS) for a given functional site prediction was the similarity score divided by the normalization factor gamma. Gamma was the average of the cumulative probabilities of the functional site predictions made for the reference structures. To calculate gamma for a given SeqFEATURE model, all the functional site predictions in the reference structures which met the criteria for inclusion in the study, that had a Z-score that was higher than the Z-score which correspond to the 90% specificity level, were utilized. An average PFSS and its standard deviation are calculated for each structure prediction technique by averaging the difference scores for the function site predictions across all the models produced by that structure prediction technique in the given time frame. A cumulative PFSS score defined as the total sum of the group's PFSS values calculated for each of the domains modeled by the modeling group.
More information about ResiRole's methods can be found in the following publication:TBD
Site Utilization
