The ResiRole Pipeline
Step 1: Retrieve Data
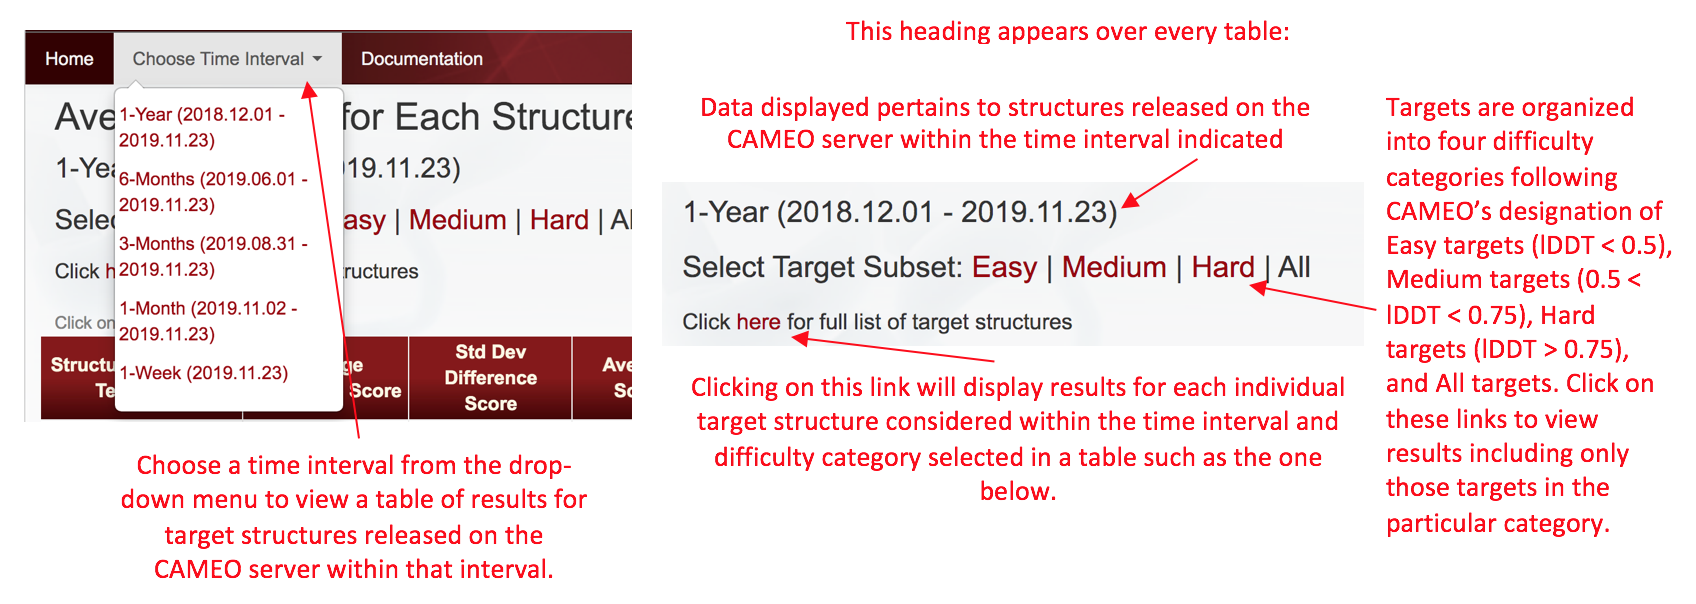
The Protein Data Bank (PDB) releases all of the experimentally determined structures received from the scientific community at large on a weekly cycle. In coordination with the weekly update cycle of the PDB, the Continuous Automated Evaluation (CAMEO) server receives primary sequences of the structures to be released and provides these sequences to all participating structure prediction technique servers (modeling servers). The resulting structure models produced by each structure prediction technique are collected and made available to the public via the CAMEO site. At any given time, CAMEO's public archives are available for the previous year's worth of data regarding the experimentally determined structures obtained from the PDB and the structure models produced by each structure prediction technique. Each week, the automated ResiRole pipeline retrieves the current year's worth of data and analyzes the models produced by each structure prediction technique over selected time intervals which extend back over a full year, six months, three months, one month, and one week.
Step 2: Predict Functional Sites With FEATURE
The central idea guiding ResiRole's assessment of structure prediction is that the more similar the functional site predictions of structure models are to the functional site predictions identified for the corresponding sites in the experimentally determined reference structures, the more accurate are the structure models. To compare models and reference structures on such bases, all models and reference structures are analyzed using the FEATURE program (version 3.0). The FEATURE algorithm is trained to score the residues in any structure passed to it based on the likelihood they participate in functional sites. To do that, FEATURE assesses the physiochemical properties around anchor residues within the structure and compares these properties to those associated with residues known to have functional sites of interest. See the FEATURE documentation for a full description of the program and its applications. ResiRole uses a list of 607 functional site models, referred to as SeqFEATURE models to score all potential functional sites in structure models and reference structures. FEATURE's results have undergone benchmarking such that it is possible to associate Z-scores of functional site predictions to estimates of corresponding sensitivity and specificity levels based on previously described known functional sites in experimentally determined structures.
Step 3: Calculate Performance Metrics for Each Structure Prediction Technique
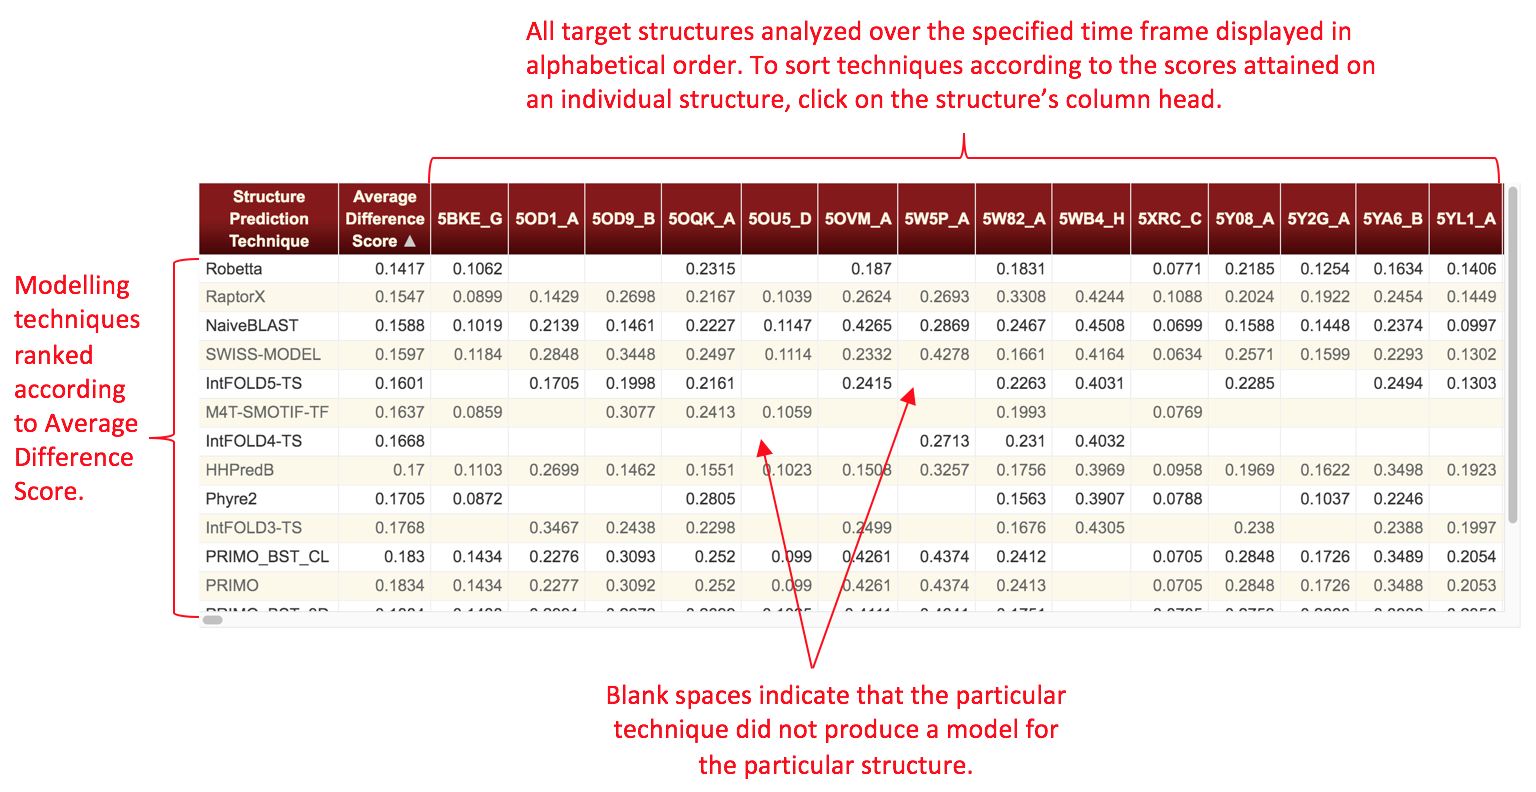
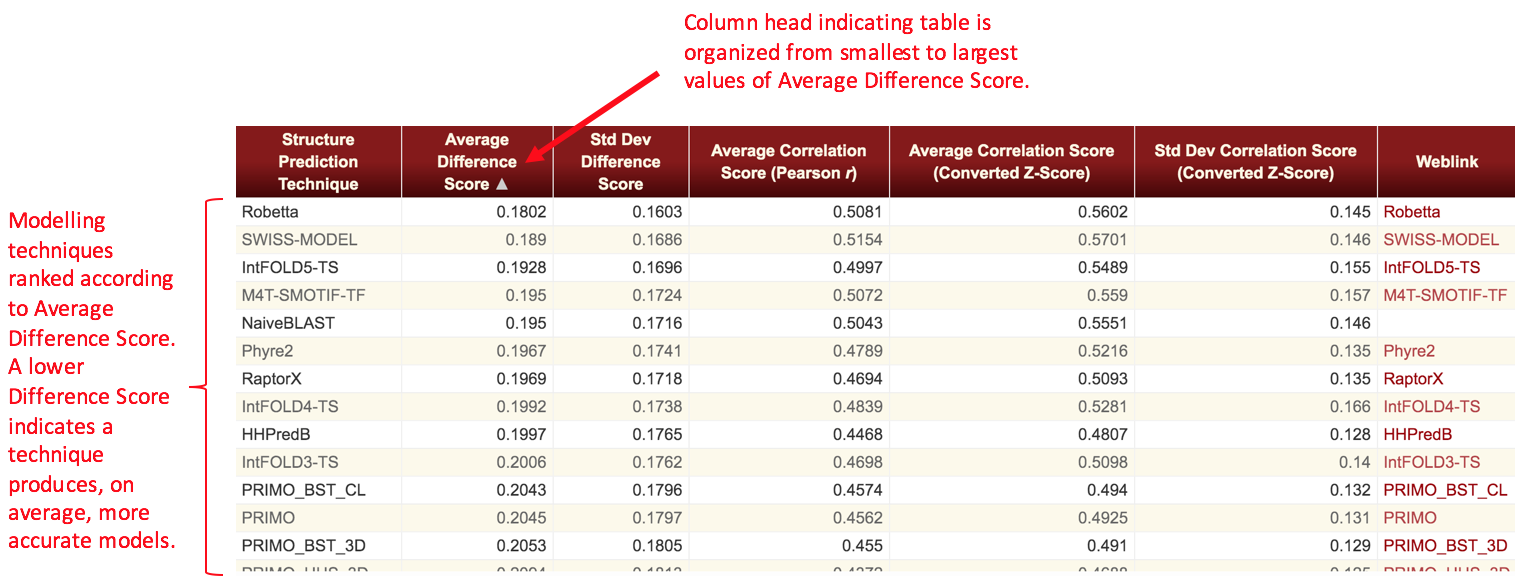
We define two metrics as the result of the analyses. The Difference Score is calculated as the absolute value of the difference of the probabilities of the function site predictions in the structure models versus the functional site prediction probabilities at the corresponding sites in the experimental structure. A difference score is obtained for each instance of a functional site prediction that is made for each residue of each structure model. An average Difference Score and its standard deviation are calculated for each structure prediction technique by averaging the difference scores for the function site predictions across all the models produced by that structure prediction technique in the given time frame. A Correlation Score is defined as the Pearson's r value associated with a linear regression fit of the plot of all reference structures' functional site prediction probabilities versus all structure models' functional site prediction probabilities for each type of functional site. An average and standard deviation of this metric is then obtained for each structure prediction technique by converting the Pearson r values to Z-scores and averaging across all types of functional sites. The average Pearson r value then reported is the back-converted average Z-score. The Difference Score and Correlation Score are therefore related as follows: the Difference Score for a particular functional site prediction is the absolute value of the difference between the x and y values of a point on a plot of reference structure versus structure model functional site prediction probabilities for that type of function prediction. The Correlation Score is the Pearson r value from a linear regression of that plot.
More information about ResiRole's methods can be found in the following publication:
ResiRole: Residue-Level Functional Site Predictions to Gauge the Accuracies of Protein Structure Prediction Techniques. Joshua M. Toth, Paul J. Depietro, Juergen Haas, and William A. McLaughlin, Bioinformatics, btaa712, "https://doi.org/10.1093/bioinformatics/btaa712.
Site Utilization
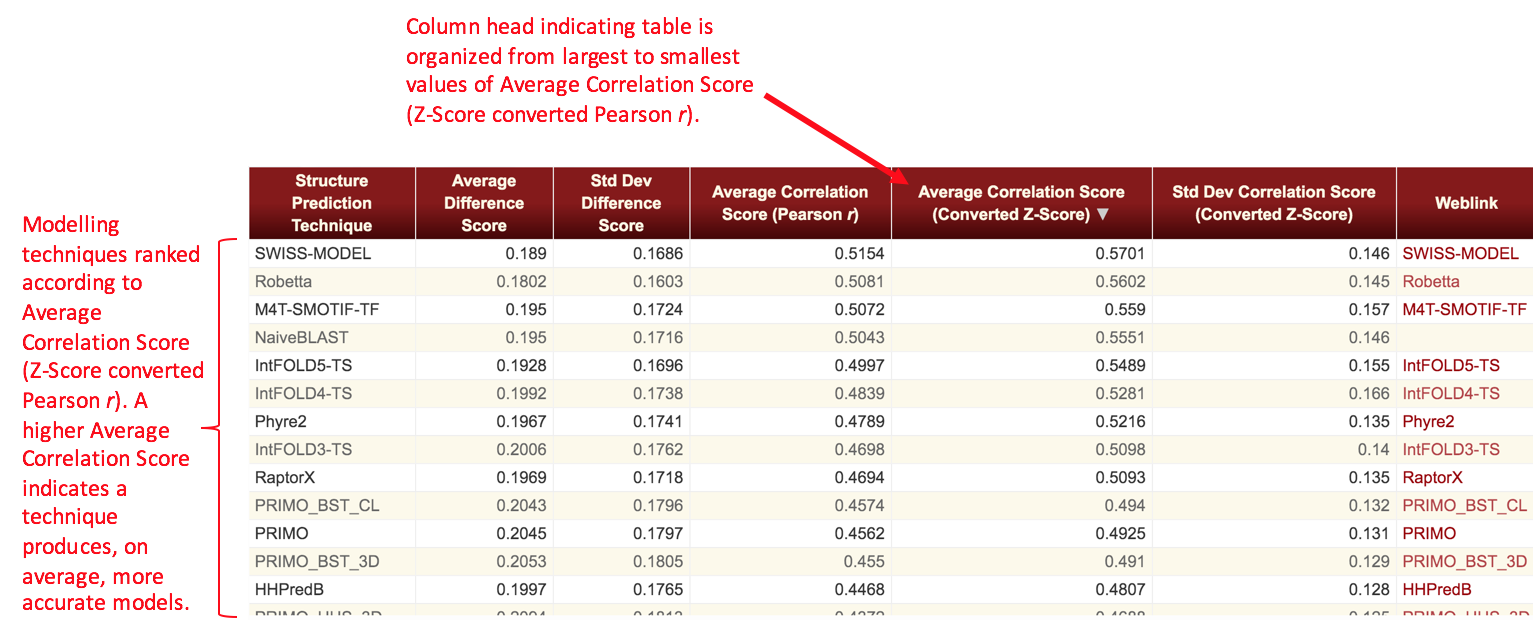
Note that some tables will have values missing for the Correlation Score metric. This occurs whenever there are only a few data points available for a server within a given time frame such that a significant linear correlation between model and target prediction probabilities could not be determined. In these cases, the Correlation Score is not appropriate for ranking techniques and thus is not displayed. In general, this only occurs for the shortest time frames considered in these analyses (1 week, 1 month).